Ecology, Technology, and Design
About this course...
The course draws on systems ecology and the history and philosophy of technology to examine the complex task of environmental building design. Rethinking ecological design at the beginning of the twenty-first century means reconsidering the strong claims made about ecology and technology—utopian and dystopian—through the twentieth century, as the impacts of technology on eco-systems were encountered.
The term ecology was first coined in the late 19th century to describe the complex role of the environment in the evolution of species, and has grown to become the branch of biology concerned with the organization and dynamics of the entire bio-geosphere. Since the 1930s, the reach of ecological thinking has been extended dramatically by two developments, increased awareness of the environmental effect of human actions and the refinement of systems theory.
Course Objectives
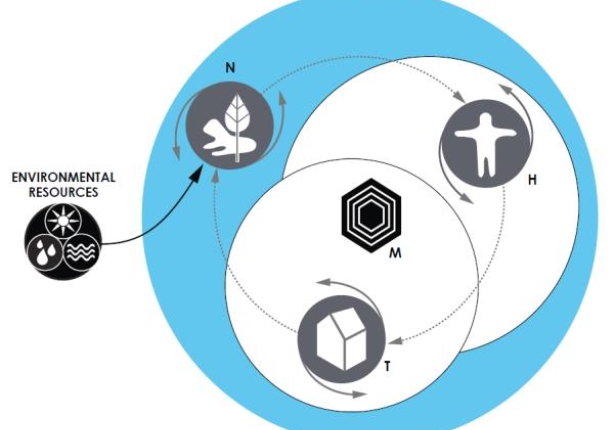
The course is organized in three, progressive modules in descending scales. The first begins with urban self-organization of sites, using cities to explore the principles of systems ecology developed by HT Odum and his colleagues. Considering the theories of self-organization, natural selection, maximum power, and energy transformation hierarchies will provide a scientific basis for the examination of energy and resource flows in buildings. The second section applies those concepts to buildings as shelters, and the third section applies them to the products and processes that occupy buildings, from working, eating, and sleeping to playing. Course work include weekly readings, in-class exercises, and a project in 3 stages. Weekly class meetings are divided between lectures, discussion, exercises, and student presentations.
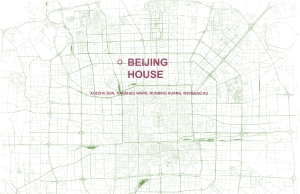
>Site: Urban Land and Location
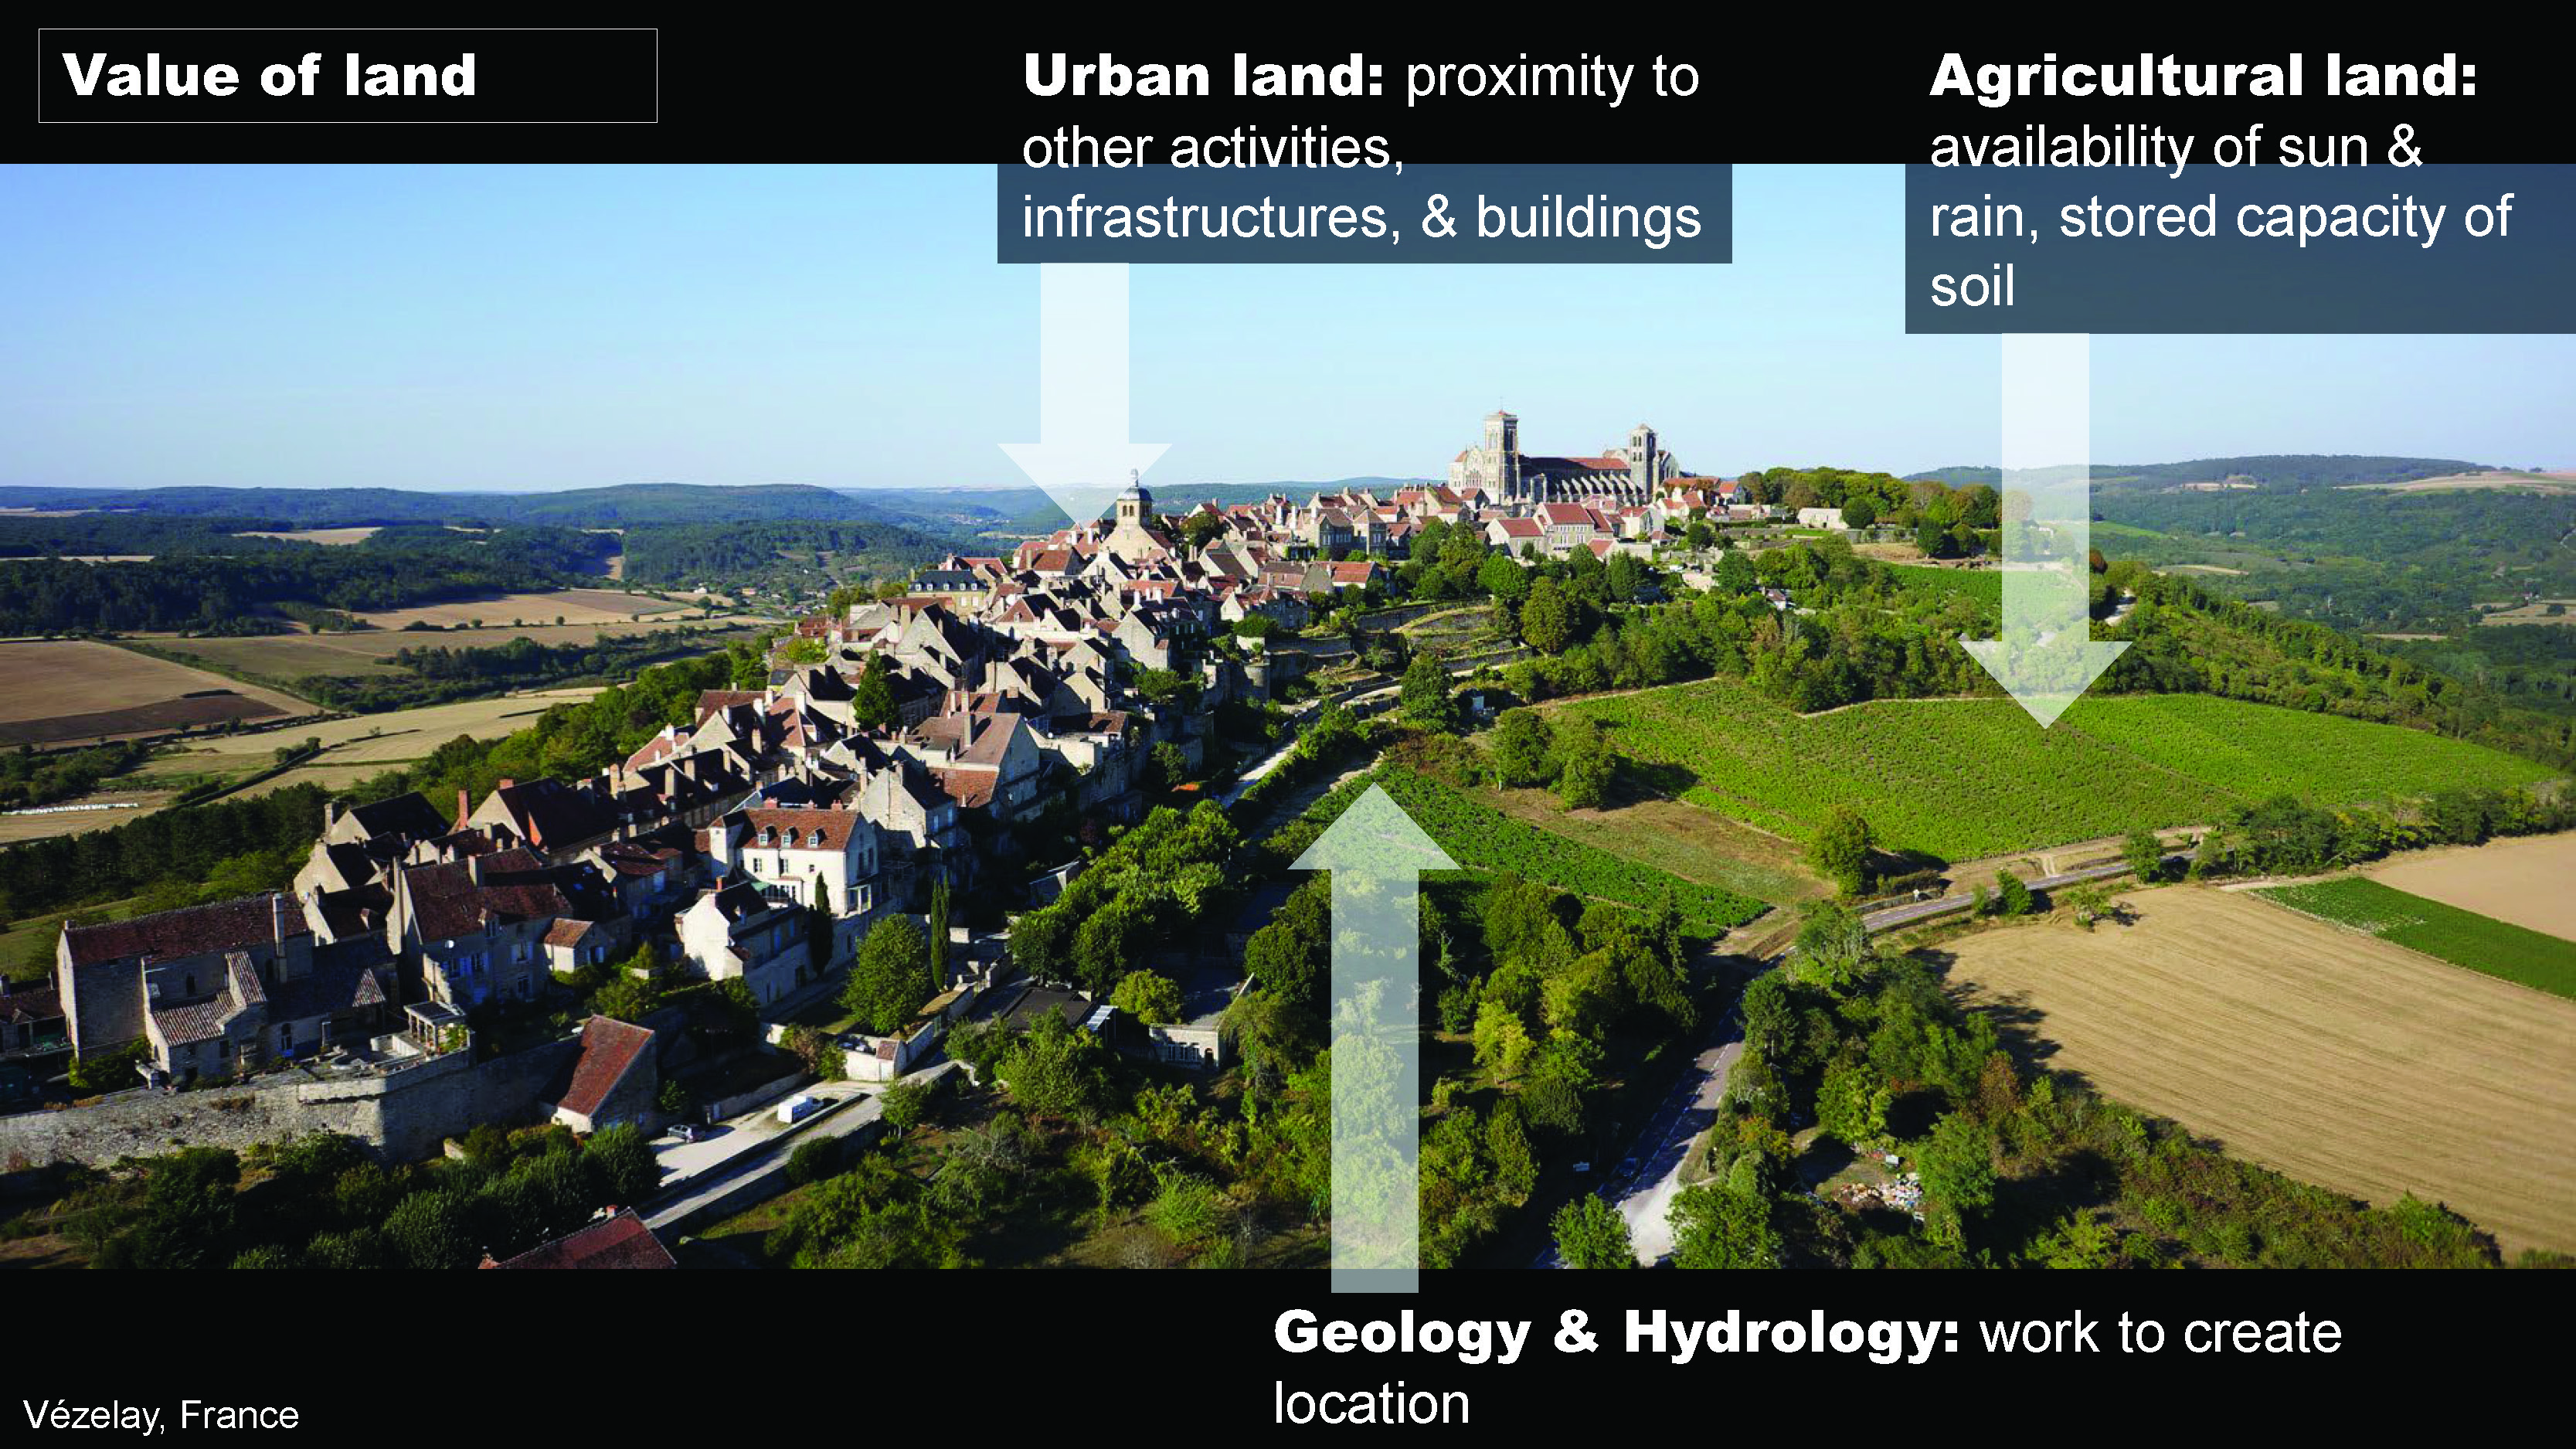
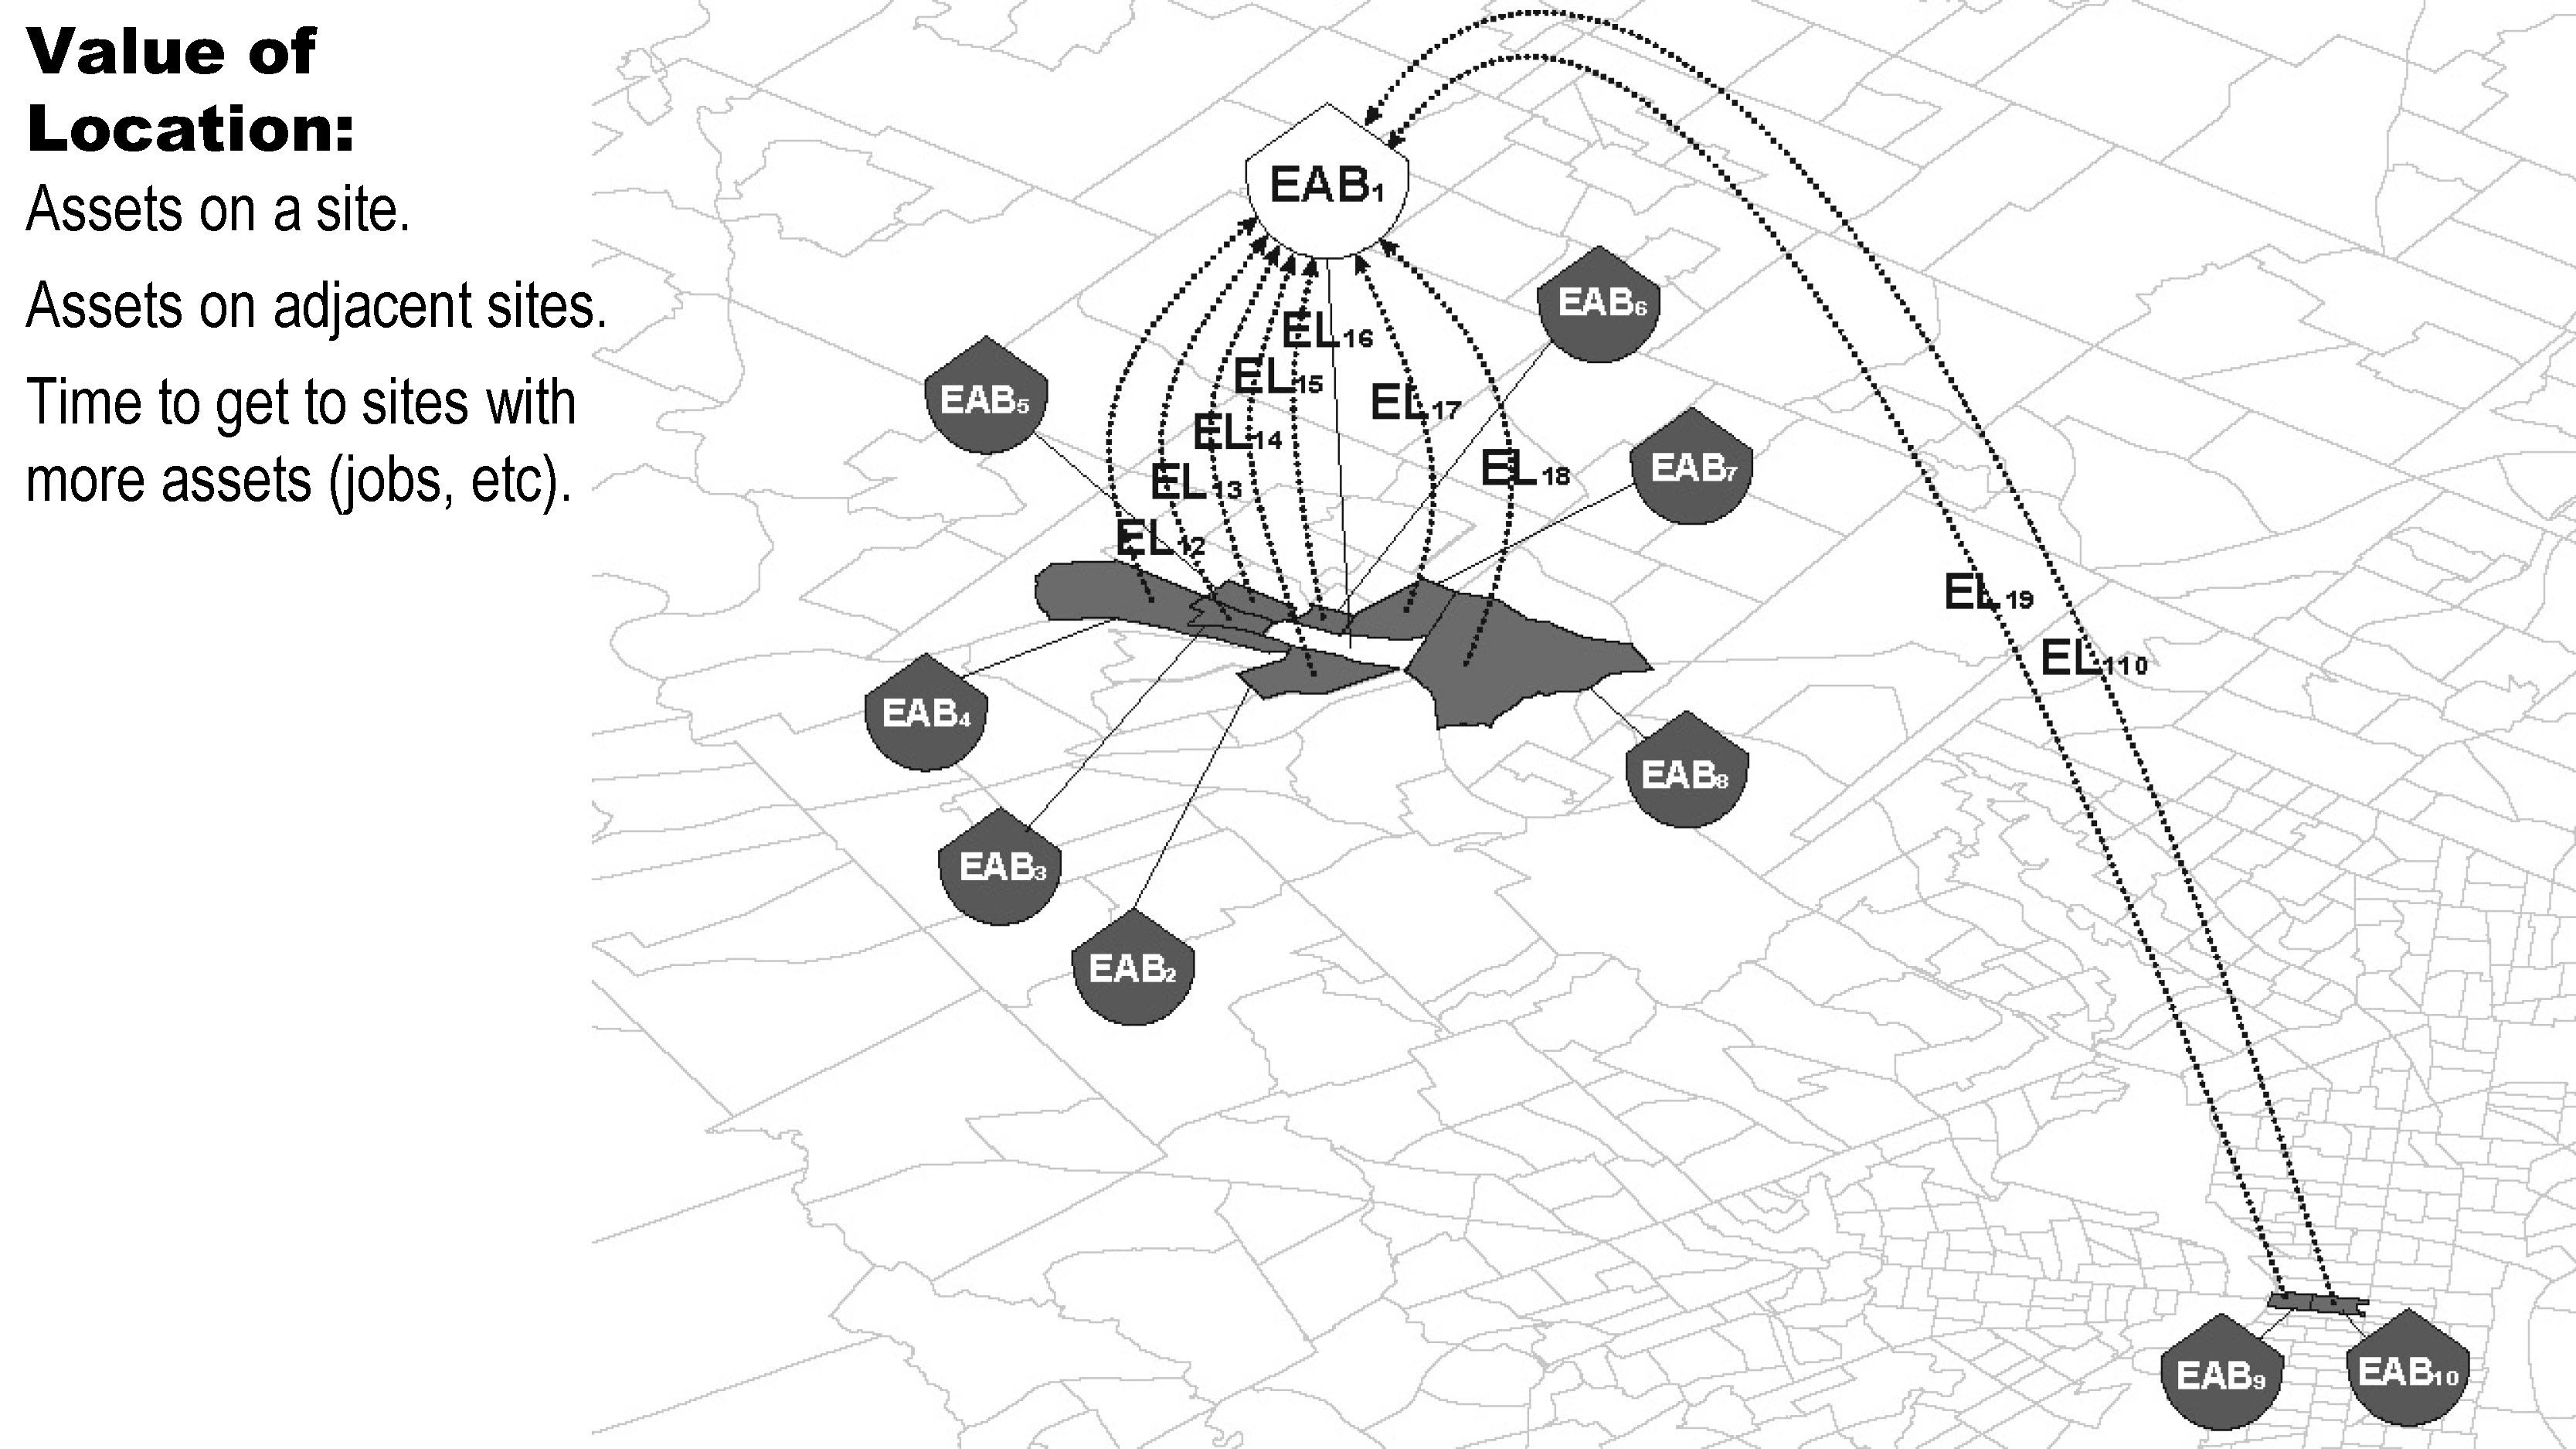
The first phase of the semester-long project involves the selection of an urban site in a city anywhere in the world. The goal of this first phase is to understand the multiple factors that shaped the site on which the residence is located and give it value. We are not just looking for data, but to understand the urban system using maps, databases, and published documents, that describe the different aspects of the site.
Why is the city located where it is? Start by explaining the foundation of the city, using maps of geology, hydrology, ecology, transportation, and/or climate, to understand why the city is located where it is. You can include any form of information: text, images, etc. What is the organization of the city? Which parts were designed and which occurred by self-organization? Use maps of demographic data, transportation networks, social surveys, or any other description you can find of the city. You can include any form of information: text, images, etc.
>Shelter: House
This second part of the course introduces Environmental Accounting, using an urban residence as a case study. Teams obtain basic documentation explaining the location and configuration of the household: map, site plan, building plans or sections, and photographs as available. Bioclimatic. Summarize the basic climate parameters: temperature normals, heating and cooling degree days, solar availability, and annual rainfall. You can use Climate Consultant (Links to an external site.) to access and summarize the data. Prepare a basic simulation of the natural thermal behavior of the building and use it to decide which strategies will most improve the performance.
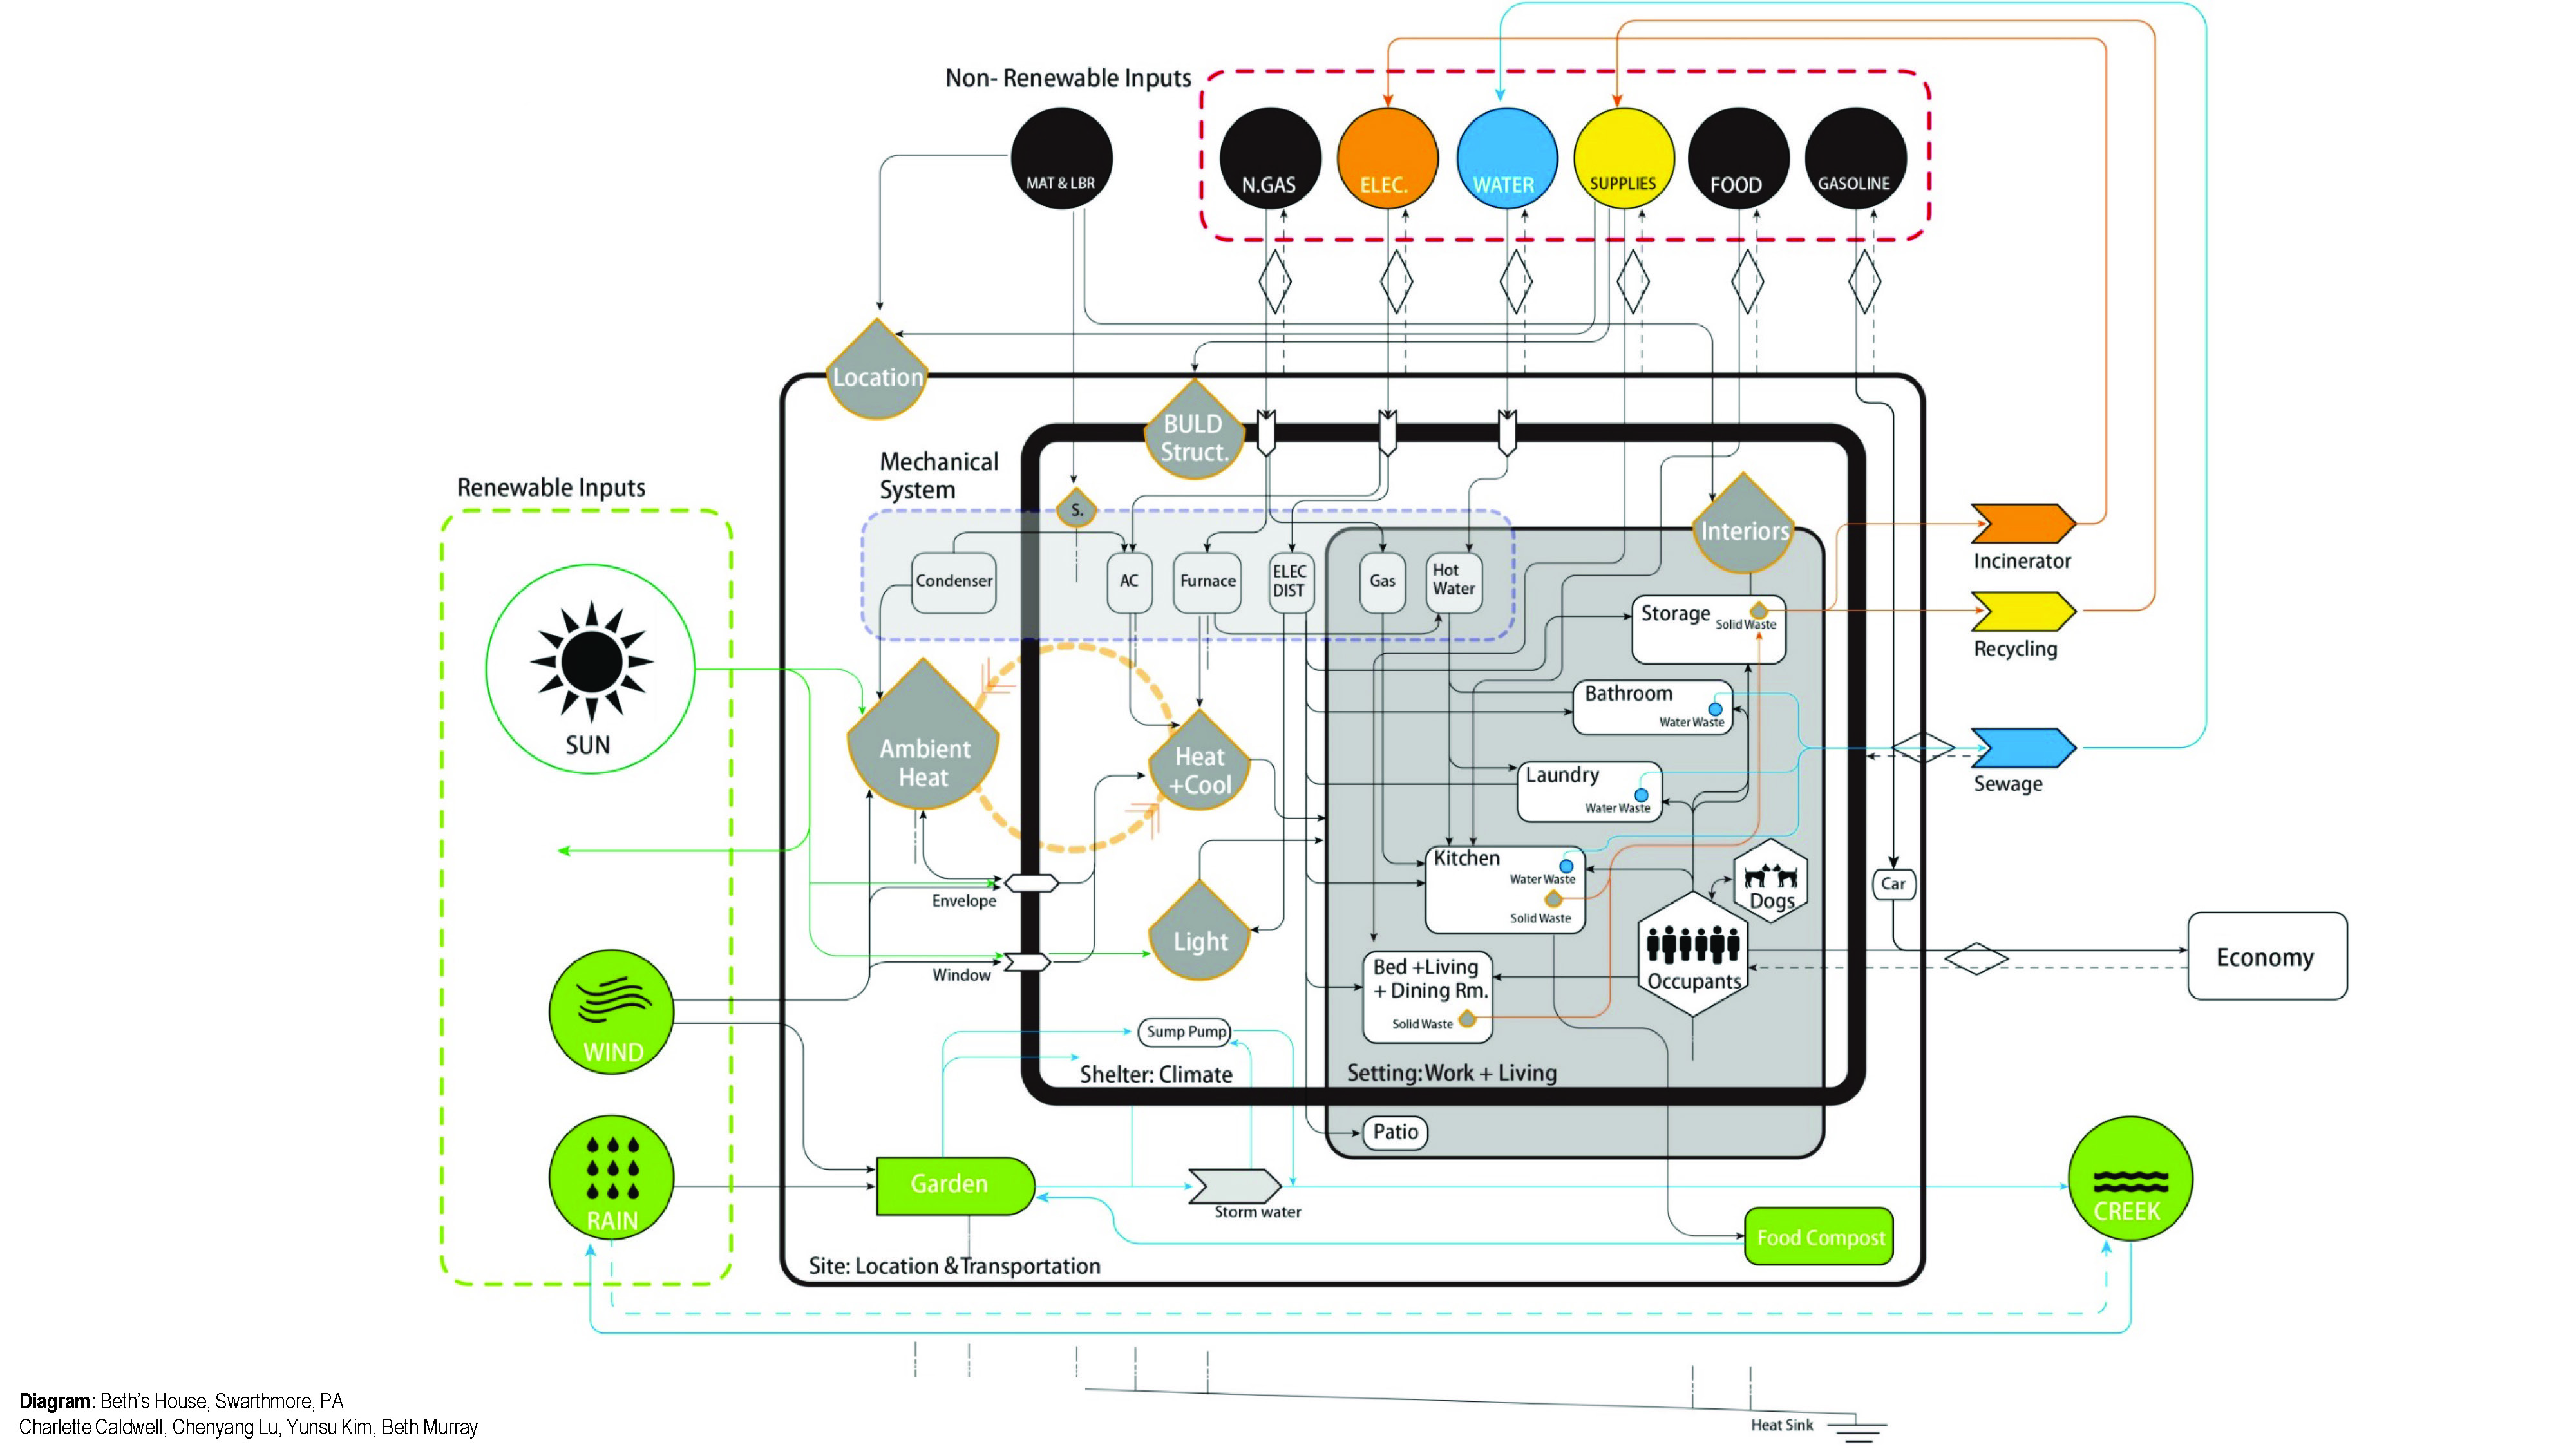
Diagramming
Using Odum’s energy/e[m]ergy notation system, develop a diagram of the building, which includes all the flows and resources involved in its construction, operation, and use. The diagram should be focused on the building, representing the various inputs as sources whose value can be expressed by their e[m]ergy intensity. These will start as messy diagrams, and will have to be edited to achieve the clarity of those shown in the literature. Which way of organizing the diagram makes it clearest? Include people and note the feedback loops required to operate the household, as well as the destination of the different forms of waste.
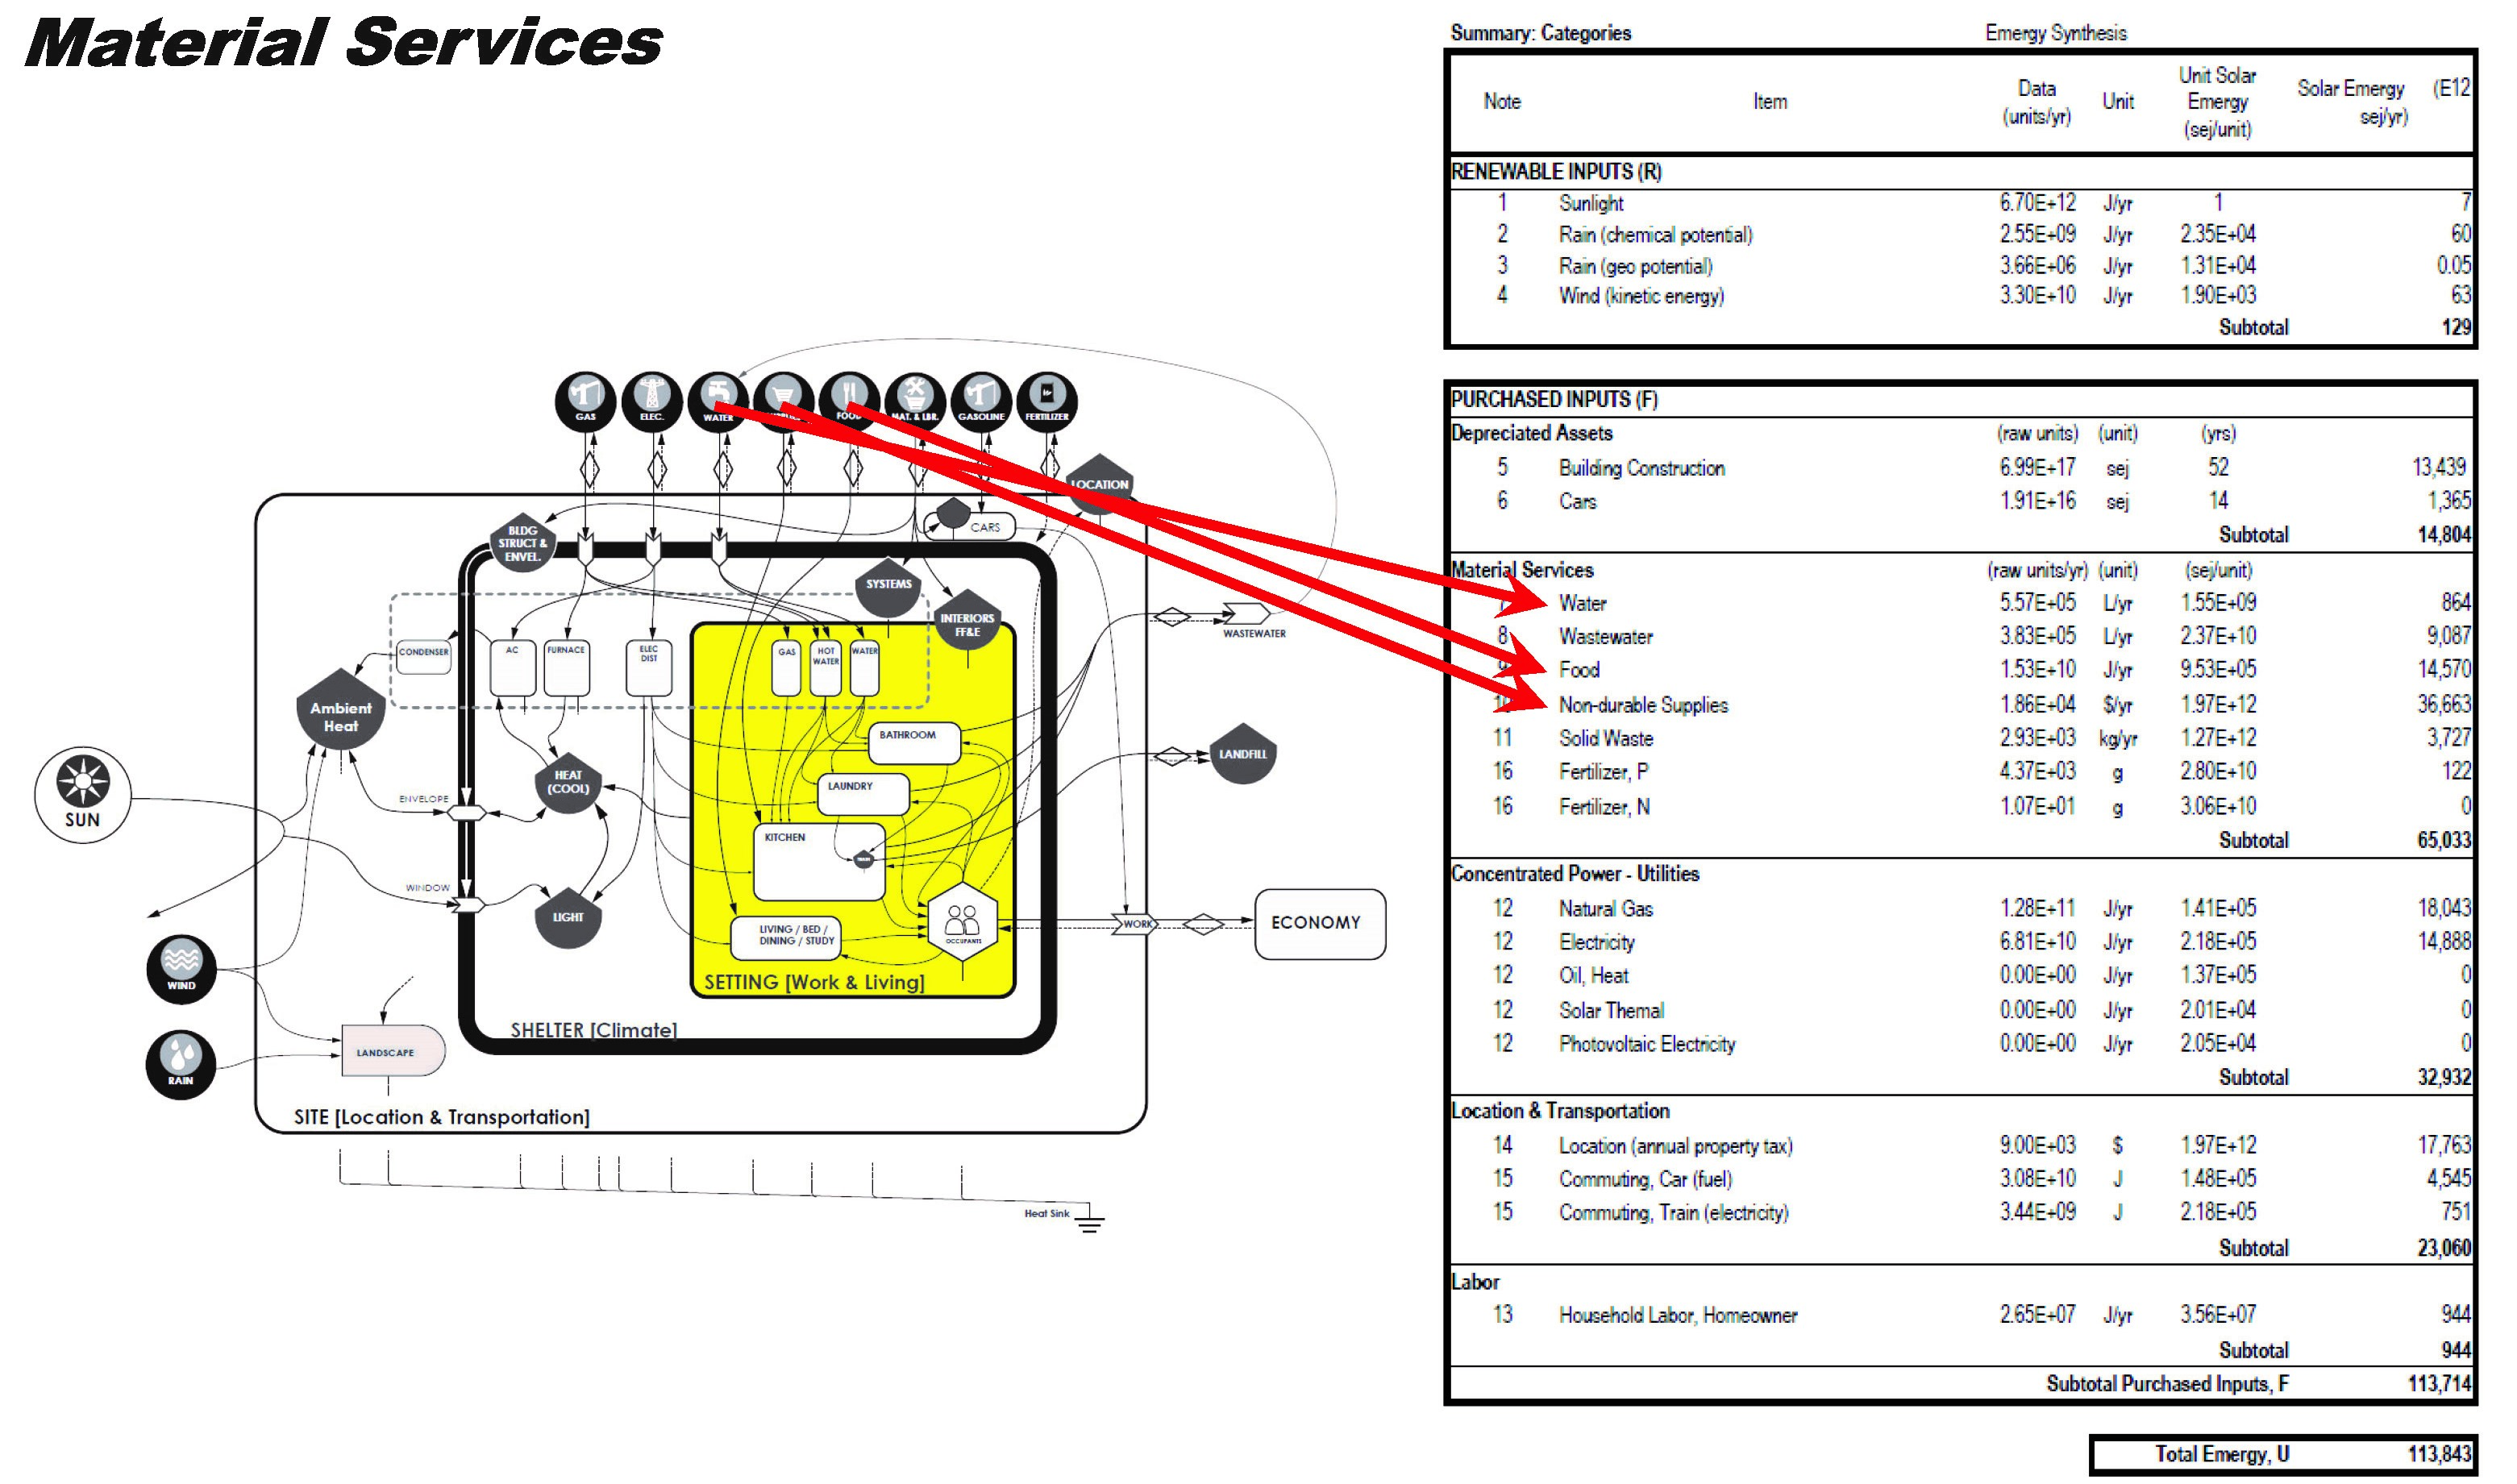
Accounting, “how much does your house weigh?”
For the accounting, use the example spreadsheet to estimate the quantities of all the stocks and flows in the different categories, and determine their e[m]ergy intensity, and total e[m]ergy content. In some cases you will have precise records of flows (e.g. utilities), in others you will have to make estimates based on norms and averages (see the DOE Databook buildingsdatabook.eren.doe.gov/ and other sources). Techniques for estimation and quantification of emergy values are included in the Ellis example, but use your best judgment. Use emergydatabase.org to locate e[m]ergy intensities for flows or materials not included in the examples.
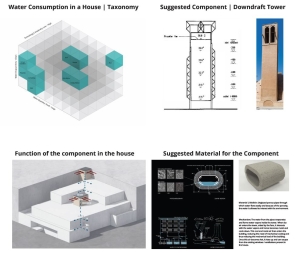
>Setting: Component
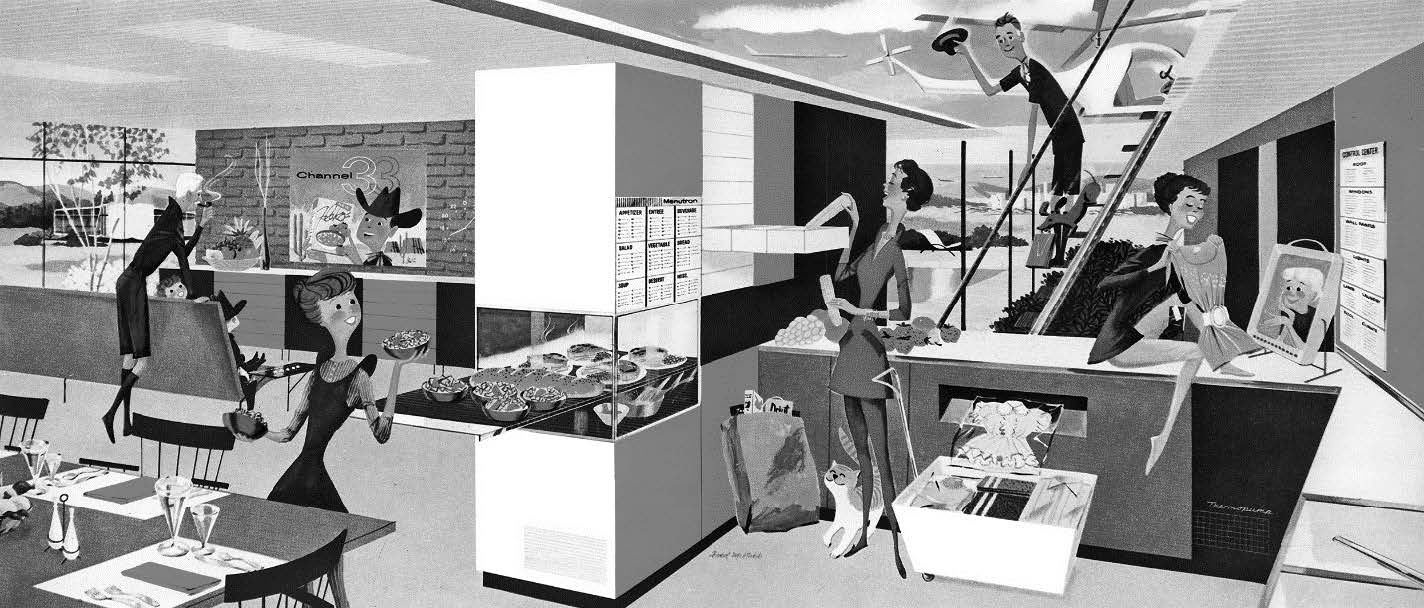
Thinking in systems. Everything we design or use is the product of a complex network of processes, which combine natural, technological, and social elements. This includes buildings, the many products and components with which they are made. Energy-E[m]ergy analysis establishes the total environmental cost of design products, and the rich socio-economic web of connections that establishes the value (and meaning) of products to their users. We use this exercise to ask how products and components come into existence and what other requirements they satisfy, so we can better understand how to alter or improve them.
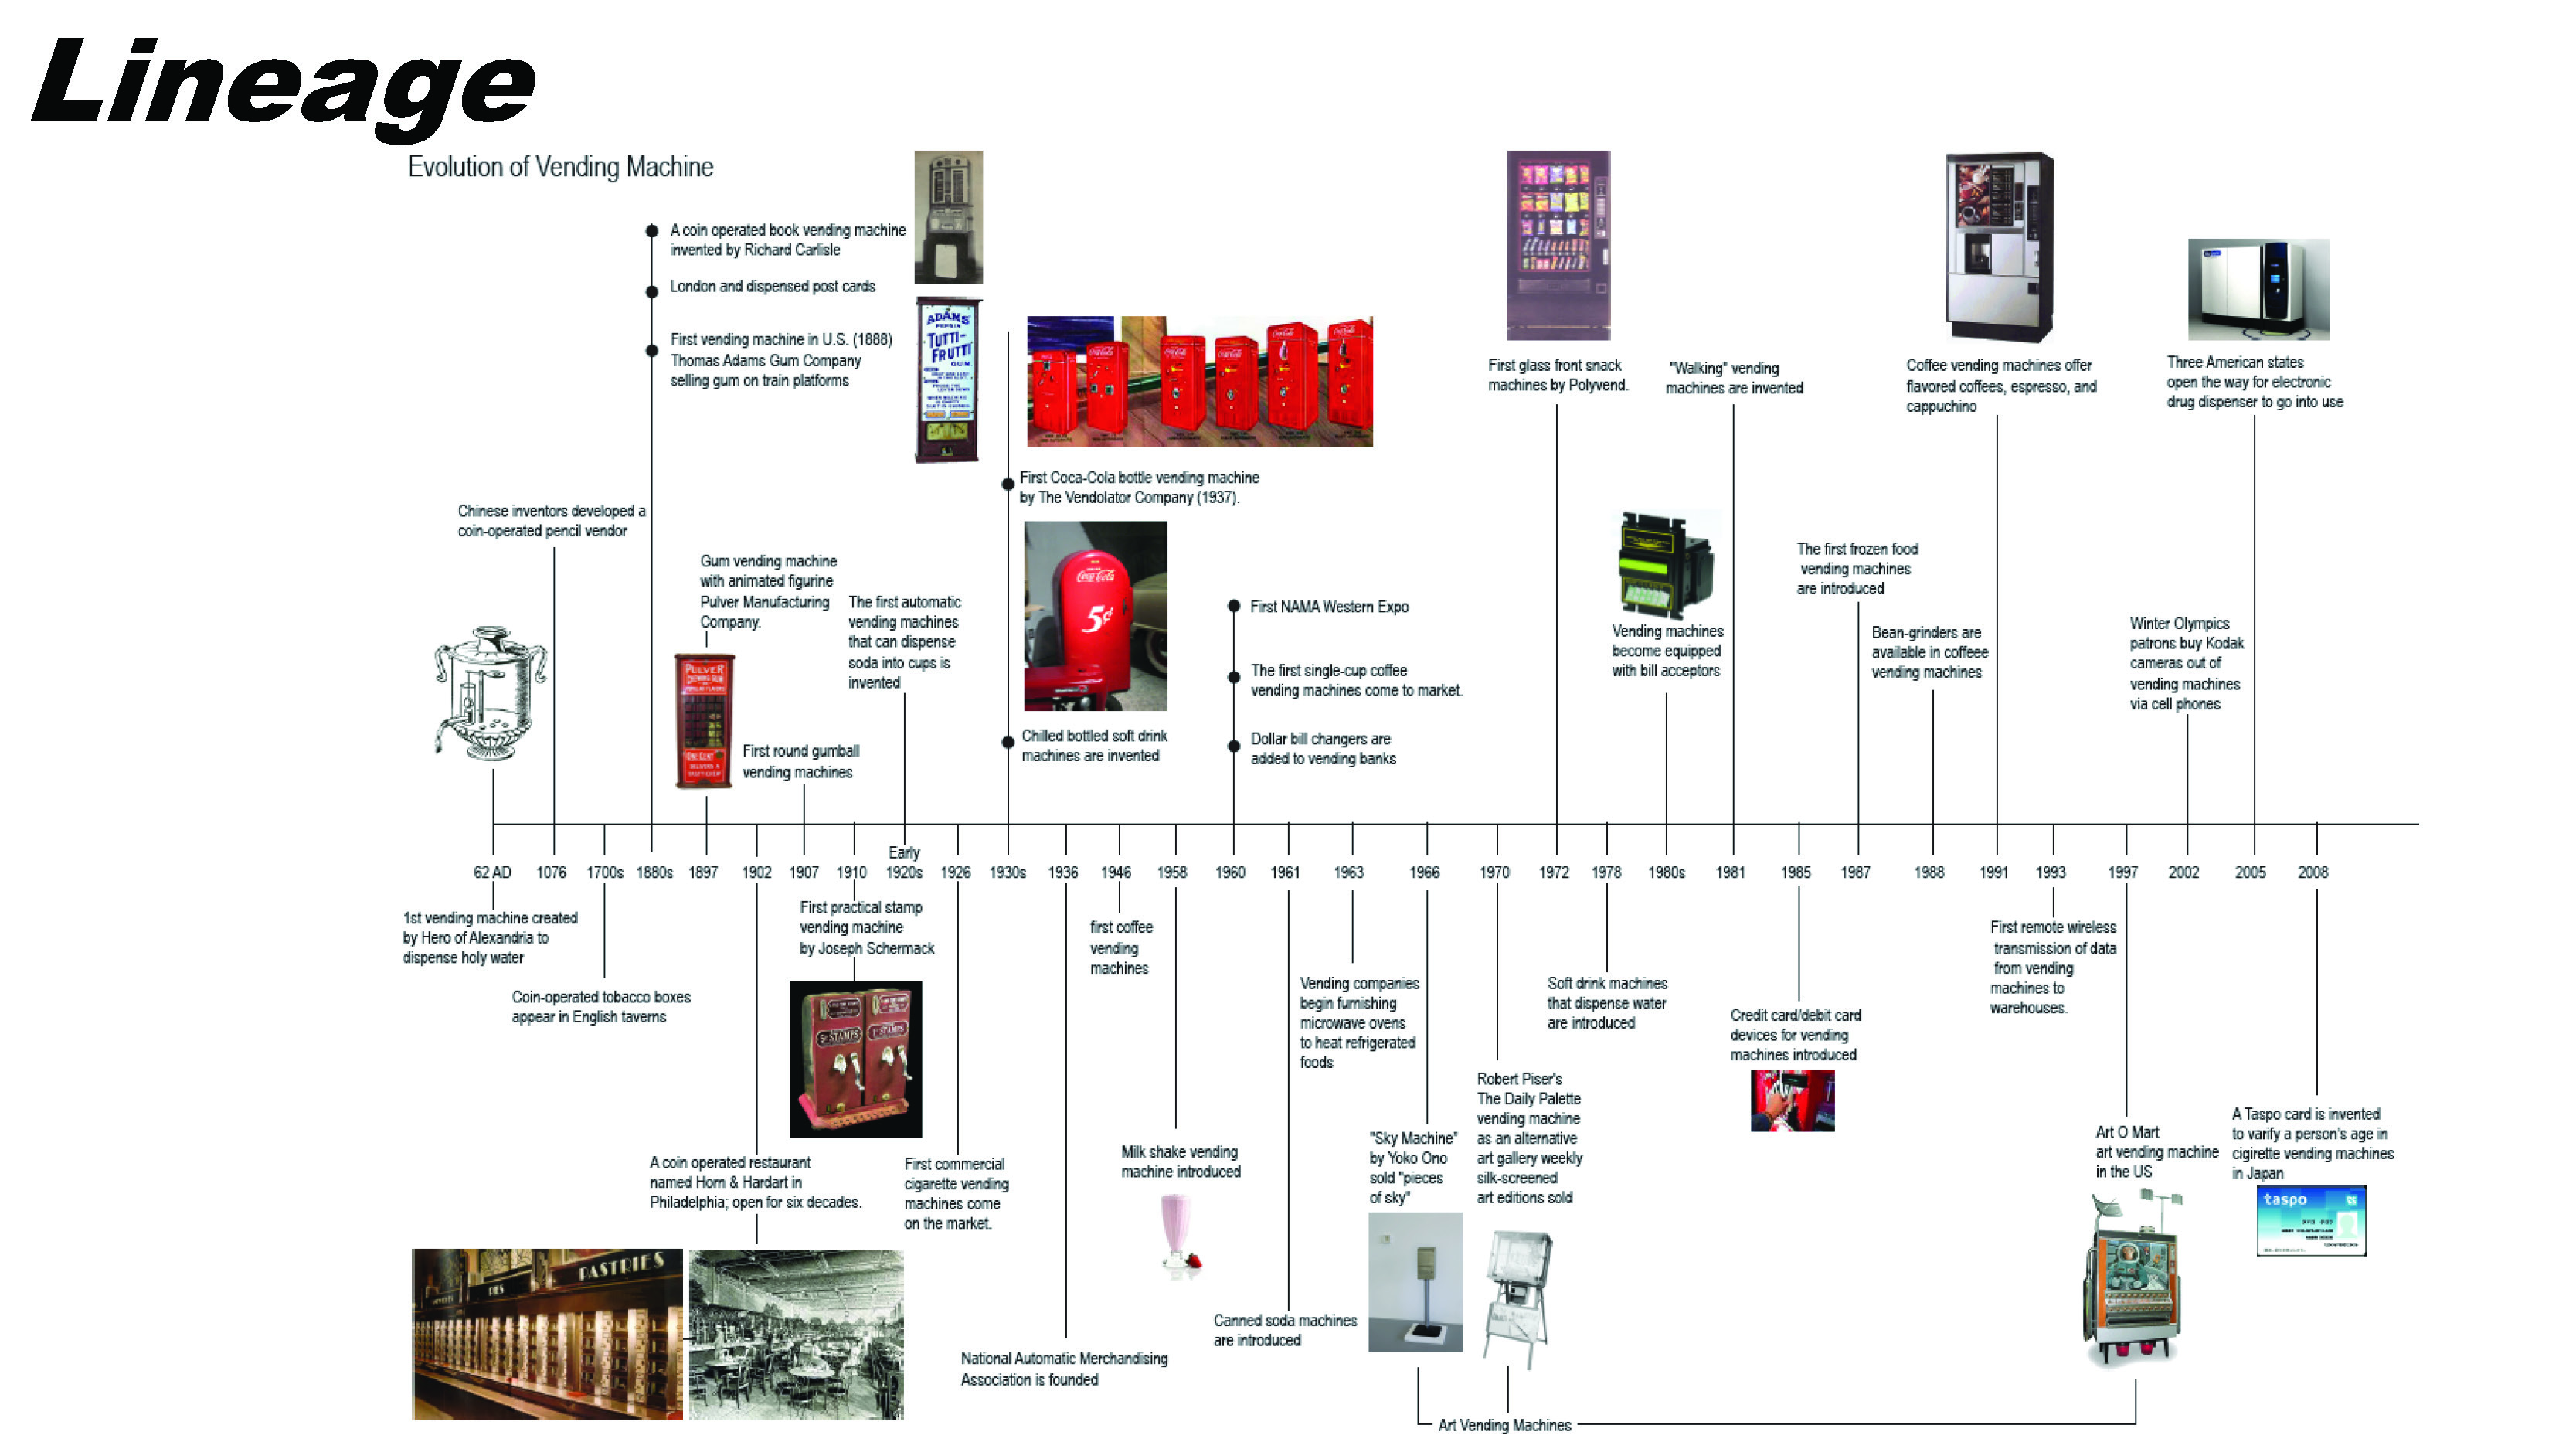
The first part of the analysis is a "lineage" diagram. which is an account of the "type" of thing, of its genesis and evolution over time. The first question to address is what is the subject of the lineage. Is it the specific product--a bic pen--for example, or pens in general, or even writing. If you start with the more general aspect, the diagram will have to include the specialization and branching into the product you are analyzing. This could also be called an evolutionary history or genealogical lineage of the object, but do not assume that the changes through time are necessarily improvements in every dimension. Also don’t assume that lineages always operate in a tree-like arrangement, technologies are often based on copying, and effectively interbreed in subsequent generations.
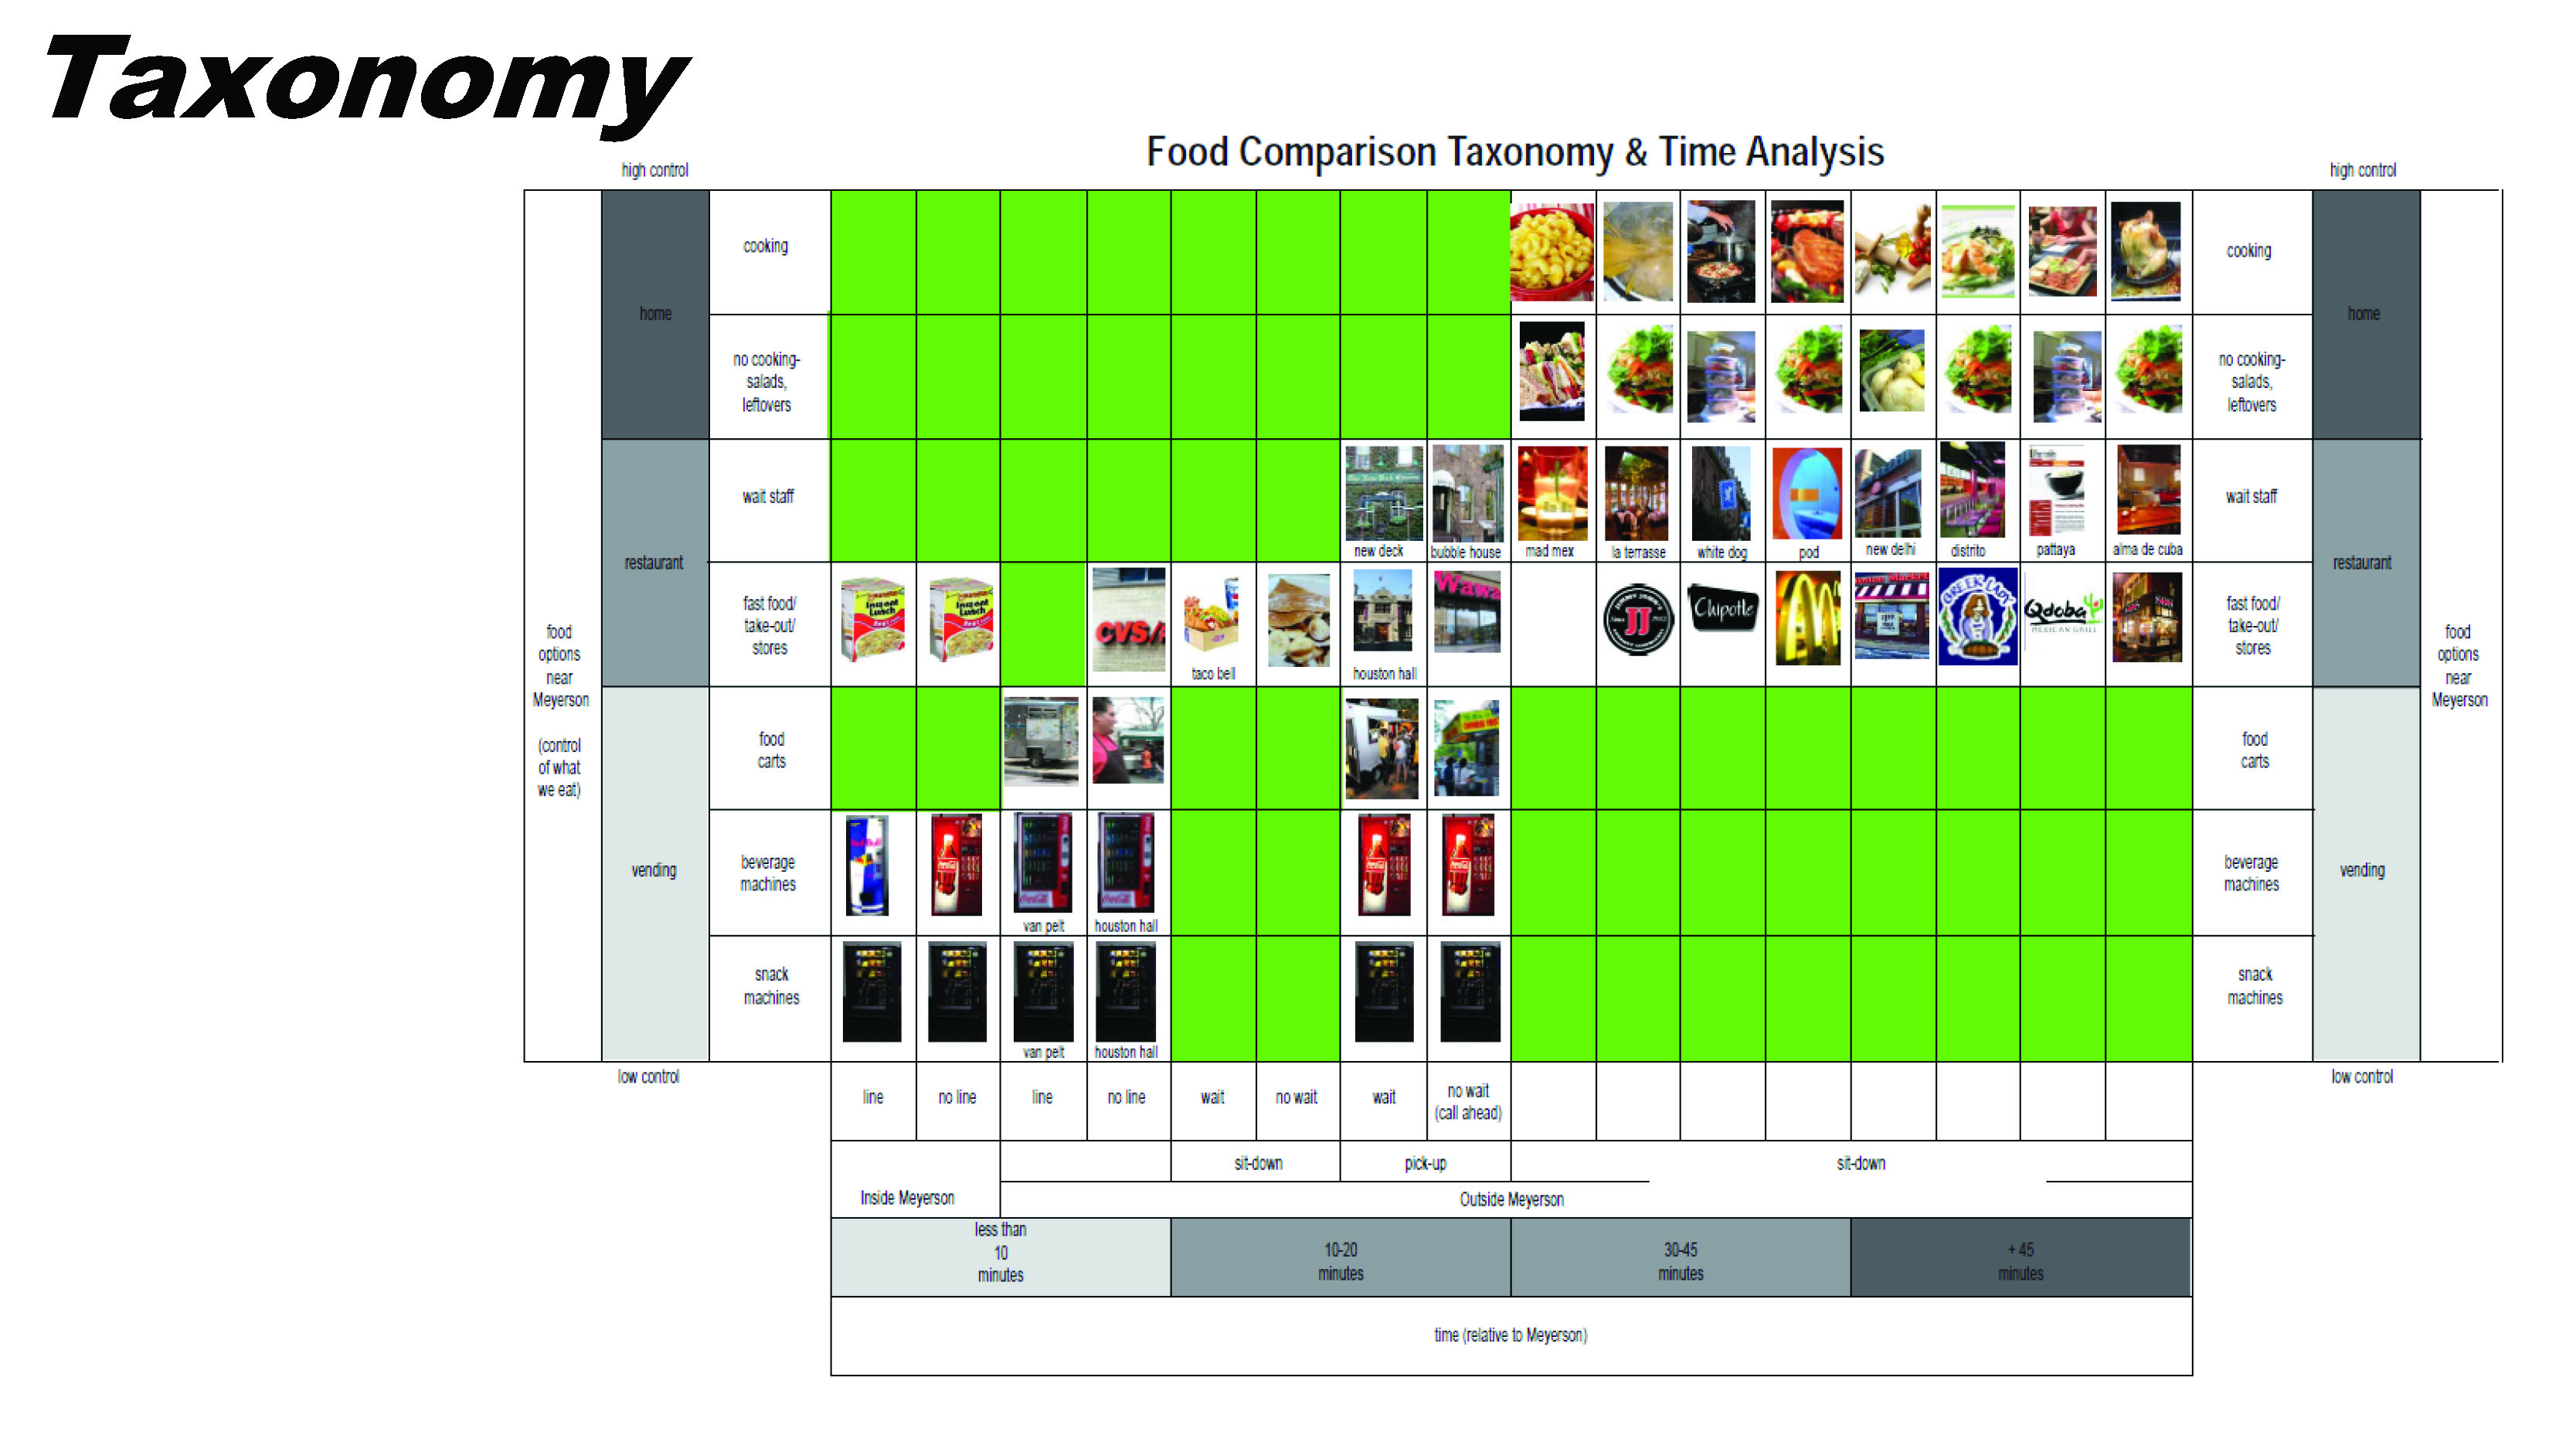
The second part is a "taxonomy." Preparing a taxonomy is a technique for examining different aspects of your research subject, for exploring what kind of thing you are actually studying, and the ways in which it is used or made. Taxonomies are a very common technique among products for sale, and are used to organize and explain the variations in a product so that they are meaningful or helpful to the purchaser or specifier.
Activity:
Lecture
Course Unit:
1.0
Course Offered:
Arch 751
Related Student Course Work
![]()
© 2023 University of Pennsylvania Stuart Weitzman School of Design